Grinding is often perceived as a necessary but expensive process in manufacturing. However, many manufacturers unknowingly leave significant cost savings on the table. Studies indicate that optimized grinding operations can reduce overall manufacturing costs by 20-40% while improving quality and throughput.
This comprehensive guide reveals seven proven strategies that successful manufacturers have implemented to achieve substantial grinding cost reductions. Each strategy includes practical implementation steps, real-world results, and ROI calculations to help you prioritize improvements for your operations.
Understanding Your True Grinding Costs
The Total Cost of Grinding (TCG) Framework
Before implementing cost reduction measures, it's essential to understand where your grinding costs actually originate:
| Cost Category |
Typical Contribution |
Often Overlooked Factors |
| Labor Costs |
25-35% |
Setup time, inspection, wheel changes |
| Wheel Costs |
15-25% |
Premature wear, incorrect selection, improper use |
| Machine Costs |
20-30% |
Downtime, maintenance, energy consumption |
| Scrap & Rework |
10-20% |
Quality failures, tolerance deviations |
| Coolant & Consumables |
5-10% |
Coolant degradation, disposal costs |
| Indirect Costs |
5-15% |
Inventory holding, logistics, administration |
Self-Assessment: Where Are Your Opportunities?
Rate your current grinding operations on these key indicators:
Each unchecked item represents a potential cost reduction opportunity.
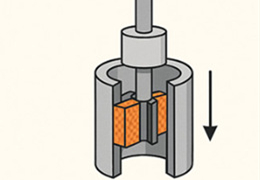
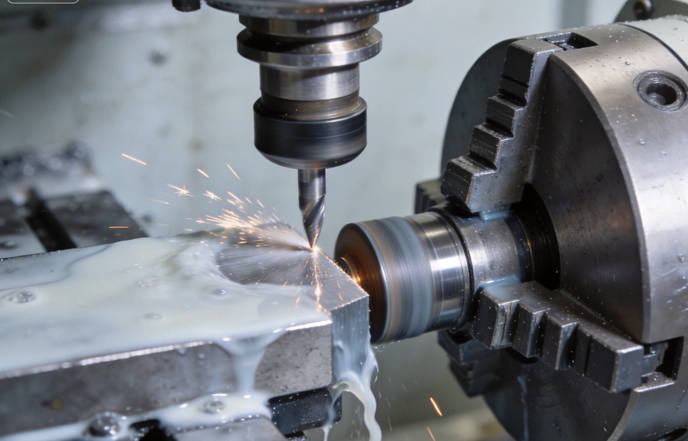
Optimize Grinding Wheel Selection and Usage
The Problem: Suboptimal Wheel Selection
Many manufacturers use the same wheel specification across multiple applications, prioritizing convenience over optimization. This approach typically results in:
- Reduced wheel life by 30-50%
- Longer cycle times by 15-25%
- Increased scrap rates due to poor surface quality
The Solution: Application-Specific Wheel Selection
Implementation Framework:
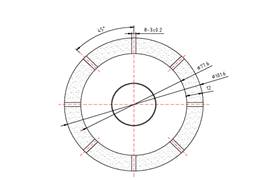
Step 1: Audit Current Applications
Create a comprehensive database of your grinding operations:
| Parameter |
Data to Collect |
| Workpiece material |
Material type, hardness (HRC), condition |
| Geometry |
Critical dimensions, tolerances, surface finish requirements |
| Stock removal |
Amount to remove, distribution across surfaces |
| Current wheel |
Specification, typical life, performance issues |
| Cycle time |
Current time, bottlenecks, opportunities |
Step 2: Match Wheels to Applications
| Application Type |
Recommended Wheel Characteristics |
| Rough grinding, soft materials |
Coarse grit (36-46), medium grade (I-K), vitrified bond |
| Precision grinding, hardened steel |
Fine grit (80-120), medium-hard grade (J-L), CBN abrasive |
| Large stock removal |
Coarse grit (30-46), open structure (12-16), high porosity |
| Finish grinding |
Fine grit (150-220), soft grade (H-J), fine dressing |
Step 3: Establish Performance Metrics
Track and compare wheel performance:
- Material removal rate (mm³/min)
- Wheel wear rate (mm³/mm³ workpiece)
- Surface finish achieved (Ra)
- Number of parts per wheel
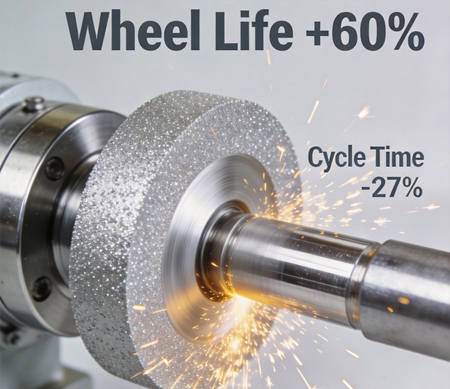
Real-World Results
Case Example: Automotive Supplier
| Metric |
Before Optimization |
After Optimization |
Improvement |
| Wheel life (parts/wheel) |
450 |
720 |
+60% |
| Cycle time (minutes) |
8.5 |
6.2 |
-27% |
| Annual wheel cost |
$48,000 |
$30,000 |
-38% |
ROI Timeline: Optimization investment recovered in 4 months through wheel cost savings alone.
Conclusion: The Path to Grinding Cost Excellence
Grinding cost reduction is not achieved through a single initiative but through
systematic, sustained effort across multiple areas. The seven strategies presented in this guide have been proven effective across diverse manufacturing environments.
Key Success Factors:
- Measure First: Establish baseline metrics before implementing changes
- Prioritize by ROI: Focus on high-impact, quick-payback initiatives first
- Engage Operators: Frontline workers have invaluable insights
- Document and Standardize: Ensure improvements are sustained
- Continuously Improve: Cost reduction is an ongoing journey, not a destination
Expected Total Impact:
Manufacturers implementing comprehensive grinding cost reduction programs typically achieve:
- 20-40% reduction in total grinding costs
- 15-30% improvement in productivity
- 50-80% reduction in scrap and rework
- 20-35% extension in wheel life
- ROI of 200-400% on improvement investments
The opportunity is real. The strategies are proven. The time to act is now.